



October Recap and November Outlook
Stocks Diverge as Treasury Yields Fall
Market performance through October 30, 2026. Economic releases through October 31, 2026. Prepared November 2, 2026.October ended with a sharp reminder that a month can look very different by its final trading day. A late selloff left the S&P 500 down 0.93% for October and the Nasdaq Composite down 5.30%. The Dow Jones Industrial Average held on to a 1.70% gain. For investors, those different outcomes made the mix of holdings in a portfolio especially important.
The economic backdrop was equally uneven. The latest reports showed stronger third-quarter growth, modest hiring, and inflation pressure from energy. The Federal Reserve held its policy rate steady, while Treasury yields fell from September's closing levels. As November begins, the question is whether growth can remain resilient while inflation cools enough to give policymakers more room to maneuver.
Let's get into the data:
· Hiring remained modest. The October 2 employment report showed that nonfarm payrolls rose by 29,000 in September, with unemployment at 4.2%. Revisions reduced July and August's combined job gains by 60,000. The October employment report is scheduled for November 6. [1]
· Energy kept inflation in focus. September's Consumer Price Index, released October 14, rose 0.6% for the month and 3.7% from a year earlier. Excluding food and energy, prices increased 0.3% monthly and 2.6% annually. Gasoline rose 9.1%, accounting for more than half of the monthly headline increase. October CPI is scheduled for November 10. [2]
· The Fed held rates steady. On October 28, the Federal Open Market Committee maintained its target range at 3.75% to 4.00%. Two members preferred a quarter-percentage-point increase. The decision left inflation as an ongoing concern rather than signaling that the work was finished. [3]
· Growth accelerated in the third quarter. BEA's October 29 advance estimate showed real GDP expanding at a 3.4% annualized rate, following 2.2% in the second quarter. Investment, consumer spending, and government spending contributed to the increase. This is an initial estimate and remains subject to revision. [4]
What Does the Data Add Up To?
These reports describe an economy with momentum, but also pressure points. Stronger growth can support business revenue and household income. Slower hiring leaves less room for disappointment, while higher gasoline prices absorb money that consumers could otherwise spend elsewhere. The GDP report covers an entire quarter, and the employment report covers September; neither provides a complete picture of conditions at October's close.The distinction between headline and underlying inflation also matters. A large gasoline increase can make the overall inflation number look worse without every category rising at the same pace. Even so, energy costs have a direct effect on household budgets. Investors will be watching whether subsequent reports show that pressure easing or spreading more broadly.
October also illustrated the difference between the Fed's policy rate and the interest rates set in financial markets. The Fed held its target range unchanged, yet the 10-year Treasury yield fell over the month. Treasury prices respond to expectations about future growth, inflation, policy, and demand for bonds. A decline in yields can support existing bond prices without a rate cut having occurred.
For stocks, falling yields did not produce a uniform gain. The Nasdaq's decline and the Dow's advance show why one benchmark cannot describe every investor's experience. Companies face different earnings expectations, financing needs, and valuations. A portfolio concentrated in one area can behave very differently from a broad allocation, even when both are described simply as investing in the stock market.
Chart of the Month: October's Diverging Stock Returns
October's major indexes finished far apart. The chart compares the same full-month period for all three, including the final trading day's losses. It shows price changes and excludes dividends.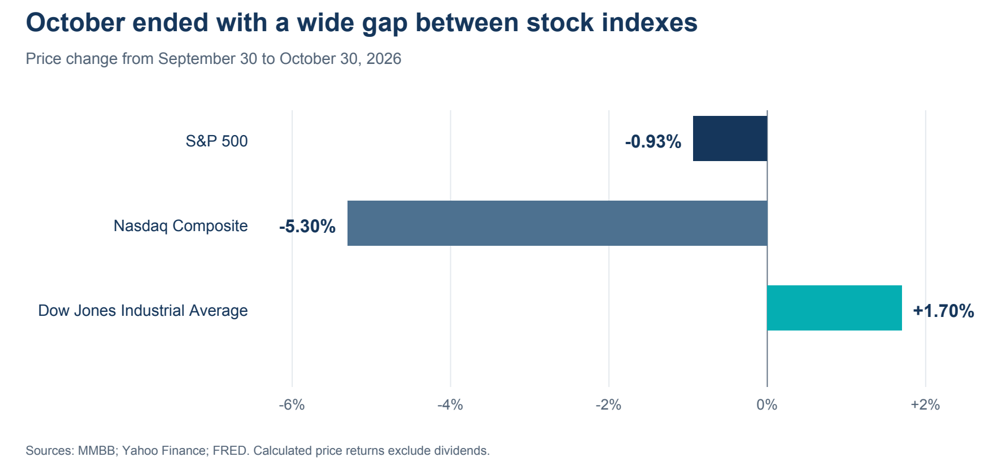
October 2026 price returns: S&P 500 -0.93%, Nasdaq Composite -5.30%, Dow Jones Industrial Average +1.70%. Calculated from September 30 and October 30 closing levels.
Sources: [5] and [6].
Equity Markets in October
· S&P 500: Closed at 7,580.07, down 0.93% for the month.· Nasdaq Composite: Closed at 25,437.00, down 5.30% for the month.
· Dow Jones Industrial Average: Closed at 51,770.31, up 1.70% for the month.
The final session mattered: the S&P 500 fell 1.82% on October 30, turning its small gain through October 29 into a monthly loss. The Nasdaq declined 2.86% that day, while the Dow fell 1.09%. The Dow nevertheless finished above its September close. All monthly figures above compare September 30 with October 30 and exclude dividends. [5, 6]
Bond Markets in October
Treasury yields declined across the maturities shown here. The 2-year yield fell from 4.88% on September 30 to 4.56% on October 30. The 10-year fell from 5.29% to 4.94%, and the 30-year declined from 5.64% to 5.31%. Those moves were decreases of 32, 35, and 33 basis points, respectively; one basis point is 0.01 percentage point. [7]Lower yields generally support the prices of existing fixed-rate bonds, with longer-duration bonds more sensitive to rate changes. The benefit varies across holdings because maturity, credit quality, and changes in credit spreads also matter. These Treasury yield changes are not a measure of total bond-market returns. For investors planning future purchases, lower yields also mean a different starting income opportunity than at September's close.
The Smart Investor
A month with such different stock-index results is a useful time to review concentration. Several funds may still leave a portfolio heavily exposed to the same companies or investment style. Reviewing that overlap can be more informative than comparing an account with whichever index made the day's headlines.It is also worth revisiting the purpose of each part of the portfolio. Money needed for near-term spending has a different job from investments intended to fund retirement years from now. A change in markets can be a reason to check those allocations against your plan, while any decision to rebalance should consider taxes, transaction costs, and your circumstances.
November's employment and inflation releases will add information, but no single report will settle the outlook. We are here to help you put the news in context and discuss whether your portfolio still reflects your goals, time horizon, and comfort with risk.
Sources
[1] Bureau of Labor Statistics — September 2026 Employment Situation, released October 2, 2026. Source
[2] Bureau of Labor Statistics — September 2026 Consumer Price Index, released October 14, 2026. Source
[3] Federal Reserve — FOMC statement, October 28, 2026. Source
[4] Bureau of Economic Analysis — Third-quarter 2026 GDP advance estimate, released October 29, 2026. Source
[5] MMBB — Quarterly Market Review, July–September 2026. Stock-index closing levels as of September 30, 2026. Source
[6] FRED — S&P 500 and Dow Jones Industrial Average; Yahoo Finance — Nasdaq Composite historical prices. October 29–30, 2026 closes. Monthly changes calculated from September 30 and October 30 closes. Source| Nasdaq history| Dow history
[7] U.S. Treasury — Daily Treasury Par Yield Curve Rates, September 30 and October 30, 2026. Source
This work is powered by Advisor I/O under the Terms of Service and may be a derivative of the original.
The information contained herein is intended to be used for educational purposes only and is not exhaustive. Diversification and/or any strategy that may be discussed does not guarantee against investment losses but are intended to help manage risk and return. If applicable, historical discussions and/or opinions are not predictive of future events. The content is presented in good faith and has been drawn from sources believed to be reliable. The content is not intended to be legal, tax or financial advice. Please consult a legal, tax or financial professional for information specific to your individual situation.


